[Eye Candy]: What’s next for GSS Energy?

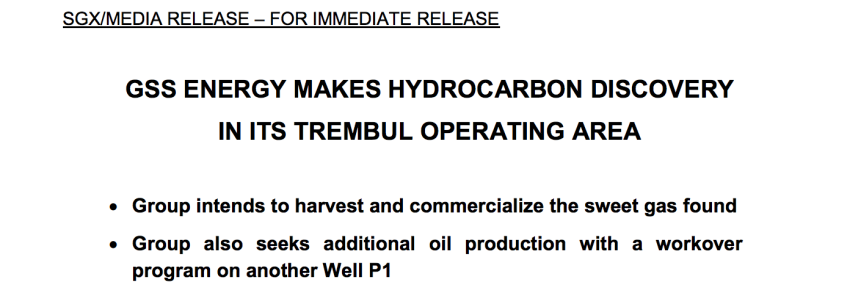
In the recent announcement by GSS, it have announced the long waited results of their oil and gas venture. I mentioned in my previous post on GSS that this catalyst is the most important for GSS in 2017 as it determines whether a not their O&G business arm will be successful. I also previously shared on IN that the most uncertain part of any O&G business is the exploration phase as a company can spend millions on setting up the place for drilling but if they can’t find substantial oil in the area, its a failed effort.

GSS logoAnd yes! They did it. The management’s postulation on the Trembul area seems to be right.

Screen Shot 2017-12-28 at 10.40.09 AM.png

In this post, I shall made a new set of possible postulations of what might happen from now on for GSS after reading the various articles and reports about GSS after they have found oil.

Summary of Announcement

According to the announcement released, there are 8 columns of hydrocarbon found under SGT-01, the well that they drilled. The first 2 being gas and the next 6 is oil.

Screen Shot 2017-12-28 at 10.56.32 AM

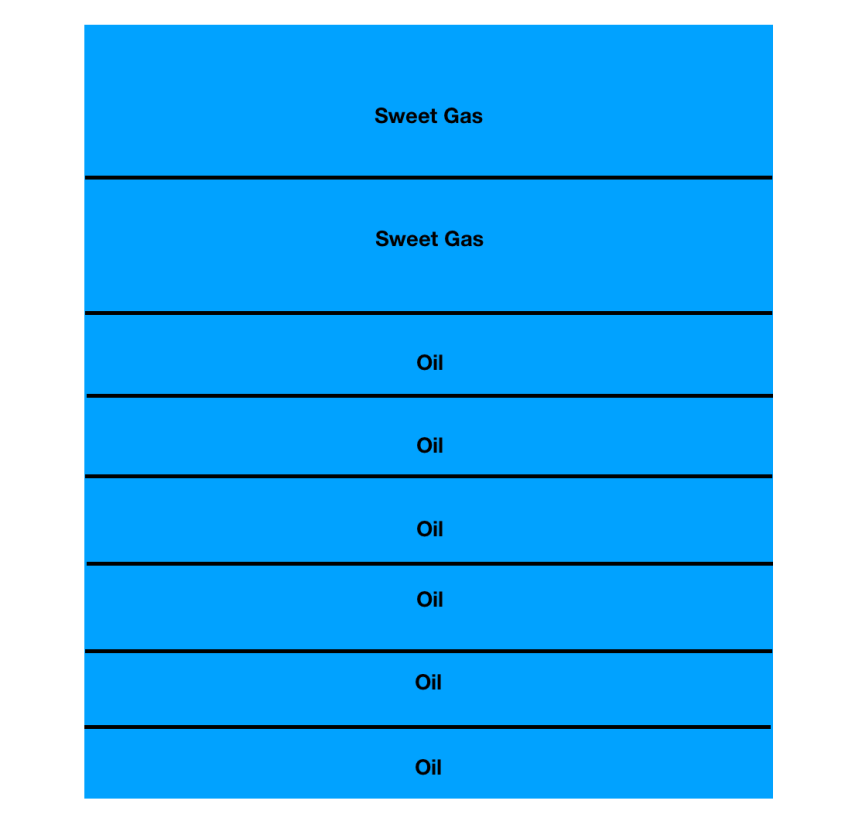
And according to in-house estimates, the 1P (proven) recoverable resources in SGT-01 is 2.83 million barrels of oil from the 6 oil zones and 8.49 BCF (billion cubic feet) of sweet gas (equivalent to 1.5 million standard cubic feet per day (MMSCFD) of sweet gas for the period of 14 years).

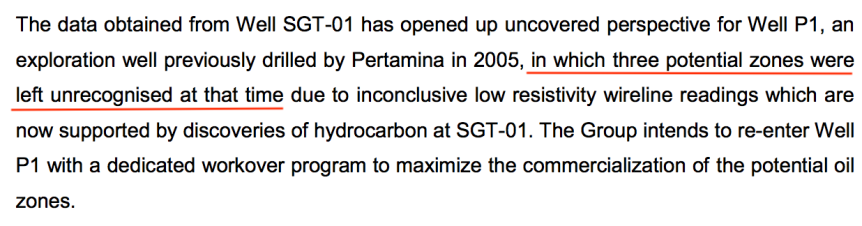
I believe that the management was very wise in choosing that location to conduct SGT-01 well exploration as it is near several other old abandoned wells which allow them to also be able to deduce the oil profile of those older wells. Because of this discovery, they were able to estimate more accurately, the oil profile in well P1 that was drilled by Pertamina back in 2005. (Well P1 have more than 3 potential oil pay zones).

Also, GSS have shelved asides plan to drill SGT-02 which was supposed to be done after SGT-01 to drill the surrounding wells near SGT-01 so that revenue can be recognised from this discovery. Another wise move.

GSS will look to monetise the sweet gas zones in SGT-01, start oil production for well P1, TRB03 and TRB06. (I am assuming right here that all these wells are chosen because they are of close proximity to SGT-01 which allow them to have a better understanding of the oil profile in those wells). All these works aim to yield 200 barrels of oil per day by 3Q18 and monetise the sweet gas in SGT-01 before the year ends.

What does all these mean?

All these will mean that GSS will finally recognise their maiden revenue from their oil and gas venture. I shall attempt to do a brief calculation of how big this is for GSS.

For SGT-01,


8.49 BCF of gas is equivalent to 8617350 MMBTU of gas. As of current natural gas price, 1MMBTU cost USD$2.65 (but let’s discount it to USD$2.50)

Total gas revenue = USD$21,543,375 = SGD$ 28,006,387.50

Share of revenue for GSS = 31.4% of total gas revenue then 89% of PT SGT = SGD$7,826,664.45

Can’t assume the net profit as we are unsure of the cost required to produce the natural gas. But one noteworthy fact is that the gas found is sweet which is of high quality and can be sold for a higher price.

For oil,

Total oil revenue = 2.83 million barrels of oil x USD$50 per barrel = USD$141.5 million = SGD$183.95 million

Share of revenue for GSS = 23.5% of oil revenue and then 89% of PT SGT = SGD$ 38.5 million.

Net profit for oil (assuming cost of production per barrel is USD$15) = $SGD 26.9 million

For SGT-01 alone, total revenue (oil and natural gas) they can get out of this = SGD$46.3 million

For Well P1,

There are more than 3 potential pay zones according to their announcement.

Screen Shot 2017-12-28 at 11.43.32 AM.png For simplicity sake, let’s just assume that in Well P1 there is only 3 oil pay zone, and that the oil profile is similar to SGT-01. Meaning for that 3 pay zones, it yields 1.41 million barrels of oil (2.83 barrels divided by 2).

Total oil revenue from P1 (assuming USD$ 50 per barrel) = USD$70.5 million = SGD$91.65 million

Share of revenue for GSS = 23.5% of total oil revenue and then 89% of PT SGT = SGD$18.76 million.

Net profit for GSS (assuming USD$15 per barrel COP) = SGD$13.41 million

For well TRB 03 and TRB 06,

Firstly we have to assume that TRB03 and TRB 06 are of close proximity to SGT-01 and they share rather similar oil profile. Because out of all the 24 abandoned oil wells that GSS could pick to work on, they have chosen these two, which I believe is after due consideration.

As we do not have much information on TRB03 and TRB06, we shall assume that both only had 2 oil pay zones. Total oil resources = 1.88 million barrels of oil

Total oil revenue from these 2 wells (assuming USD$50 per barrel) =  USD$94 million = SGD$ 122 million

Share of oil revenue for GSS = 23.5% of total oil revenue and then 89% of PT SGT = SGD$25.5 million

Net profit for GSS (assuming USD$15 COP) = SGD$13.7 million


TOTAL GSS REVENUE FROM ALL THESE 4 WELLS = SGD$ 90.56 million 


Assumptions Made,

  1. All wells have similar oil profiles as SGT-01, but to be conservative, I have assumed P1 only had 3 oil zones when there are more and also only assigning 2 oil zones each for TRB03 and TRB06 which should be much lesser than it could possibly be.
  2. I also assumed a lower oil price of USD$50 per barrel
  3. Cost of production is said to be USD$10 – $15 per barrel but I took the high end to calculate for all.
  4. Exchange rate used is USD/SGD = 1.3


What could go wrong?

Despite all the rosy picture about them striking oil, I would also like to analyse what can possibly go wrong. They may meet with some execution problem, where they are unable to successfully withdraw the oil or the gas.

SGT-01 is the very first exploration well that they drill. Supposedly, SGT-02 will be the next exploratory well and when they go there, the risk of not finding substantial amount of oil to commercialise will remain. The risk remains that when they drill in other areas of the Trembul operation area they might not find enough oil to commercialise it. So you can think of SGT-01 as the first battle won out of the many other battles that have yet to be fought.

Potential Catalysts

Their PE business have been doing rather well. The CEO have been talking about seeking to unlock value in the PE side of the business for sometime now. That could come in the form of a strategic divestment of partial ownership of the business or seeking a spin off of the PE side.

After all, the name GSS Energy is a clear indication that CEO Sydney wants to grow the oil business into a full fledge business to stand on its own. So I am looking forward to the oil business gaining some stability before CEO spins off the PE side of the business in 1-2 years time.

Of course, a clear catalyst for the oil business would be the discovery of more oil reserves in the area, which I think is very possible. If they continue with the strategy of digging exploratory wells near old abandoned wells, its very likely that oil can be found there.

In conclusion,

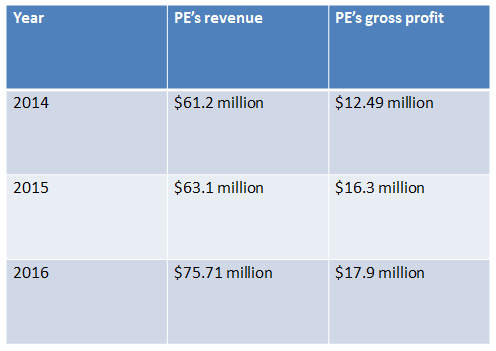
the total value of the 4 wells they are working on is worth SGD$90.56 million. At the price of $0.175 which is the price the CEO last bought from the open market, the market capitalisation is only SGD$ 86.8 million. Which is undervalued as they still have a functioning PE business delivering about SGD$75.61 million in revenue for FY 2016. Furthermore, this is only phase 1 of the oil business for GSS, they can still strike oil in other areas of Trembul with the 22 untapped abandoned old wells.

I would say that GSS is a long term play as the initial period of oil production is usually the hardest. Holding it for 2-3 years should see the real value being uncovered should everything goes according to plan.

PS I am vested.

Links where I took my information from:

http://infopub.sgx.com/FileOpen/SGX-GSSEL_20171213-Completion_of_well_SGT-01.ashx?App=Announcement&FileID=481906

https://www.nextinsight.net/story-archive-mainmenu-60/939-2017/11930-gss-energy-first-oil-discovery-with-sweet-gas-surprise


[Eye Candy]: An in depth look into GSS Energy

Hello all! Today I will be doing a deeper analysis of GSS Energy. I am personally vested in this company hence, I would advise readers to exercise their own discretion when reading this post. Recently, GSS’s stock price have been going on a rollercoaster ride and many people including myself were thinking of cutting loss. But I held on because the prospects of the company are bright and the business fundamentals are sound. In the coming paragraphs I will bring you through GSS’s business and the outlook.

GSS logo

GSS Energy mainly operates in two business segments. 1) The precision engineering business and 2) the Oil and Gas segment. To let you understand a fuller picture I did a timeline of GSS transformation from 2013.

GSS timeline 1.png

GSS timeline 2.png

If you realised I never really talked about their PE business in the timeline above because during the period of 2013 to 2017, GSS took a huge plunge by venturing into the O&G sector which caused the main bulk of the movement in share prices. But since you got a fuller picture of what happened within this critical time span for the company, I will now analyse the respective business segments and their prospects.

1) Precision Engineering

GSS’s core business has always been precision engineering. In fact, they were a pure play PE firm before the new management decided to bring them into the O&G sector. Many people don’t realise that GSS Energy have a functional and profitable PE business. Come on the company’s name itself is misleading enough haha! So let’s take a look at how the PE business have done so far since 2014.

PE business.png

Both revenue and gross profit have been growing. That’s a good sign. Also, in 2017 they are shifting to a larger facility in China which will allow them to accept larger and more sophisticated orders as they capitalise on the chance to improve the new facility.

And for 1Q 2017, their PE business continued to grow at about 28% Q over Q.

1Q2017

That is kinda impressive. With so many competitors in the PE industry, it is sometimes hard to grow one’s business. However GSS PE business have been able to consistently grow their PE’s business revenue and gross profit for the past 3 years. This shows that the management are able to position the company’s services such that it attracts larger sales order from existing customers or obtain new customers to the company and at the same time reduce cost of production.

The thriving semiconductor industry in 2017 have become a favourable tailwind to GSS’s PE business. With a strong record of building up the PE business, and demand for electronics set to grow this year, this could be a record year for the PE business for GSS. In fact, the CEO have also considered plans to further grow the PE business through strategic acquisitions or collaboration, spinning off the PE business have also been considered by the CEO. That shows the confidence he have in the PE business.

2) Oil and Gas exploration

I think this is the main segment that is important to many investors. Since this business is new to GSS and there have been a case of their failure in this new business segment. The CEO’s concept in the O&G is not ordinary. He wants to ensure that there are certainty of oil in the ground and that it must be low cost so that they will not be badly affected by changing oil prices.

CEO Sydney’s way to achieve those objectives was to acquire old abandoned wells in Indonesia and drill them. The rationale for that is simple. Back in the old days, the colonialists have created many oil wells for their own needs. But in WW2, the colonialists destroy these oil wells so that the Japanese could not get access to these resources. So by acquiring these old oil wells, the cost of production of drilling for oil in that area becomes low. (About US $12 per barrel estimated)

Of course, not every old oil well contains oil reserves. Extensive studies have been done by GSS before committing to any sites. The current one that they are working on the Trembul Operation Area is in the same basin as the one Exxon Mobil use to draw oil, so certainty of obtaining oil seems to be quite high. And if the Trembul Operation is a success, the CEO have in mind to expand around the area in order to grow their O&G business to be a full fledge player in the industry.

Also, the type of agreement that GSS signed with PT Pertamina, Indonesia national oil company is different from the one they signed in the 2014 debacle. For this arrangement, money earned in the sale of oil is first used to pay off the cost of production of the oil before profit sharing is done. And since, the oil is bought by the government there are some forms of certainty in the buyer.

Risks

Yup the risks of not obtaining oil, execution risk and low oil prices are definitely there. But in my opinion, these scheme of arrangement with Pertamina puts GSS in a better position to reap profits from the venture. Unless oil price falls below US$20 per barrel which is rather unlikely, this remains profitable for GSS. Also, as a show of confidence, CEO have been buying shares in Jan 2017.

 3) Fundamentals

Balance sheet

GSS balance sheet looks fine. I am more concern about debt since O&G companies around the world have been going bust because of debt issues.

balance sheet.png

Debt free company! And the group have a rather strong cash reserves of about $11 million.

Cash Flow

gss cash flow.png

Cash flow is improving. Free cash flow have been rising ever since 2014. That is definitely a good sign. Haha credits to Investingnote for doing the calculations! 🙂

Insider ownership

The CEO holds 17.99% stake in the company and a non-independent, non-executive director Glenn Fung holds a 13.44% stake in the company.

stakeholders.png

That’s a combine 31.43% stake in the company from 2 members of the board in GSS. The management definitely have their interests aligned with the shareholders. Furthermore, the CEO have been buying up shares in 2017 as well.

4) Outlook

I feel GSS have more legs to run. Backed by a profitable PE business and with the oil business coming online in 2017, this could be a good year to watch for GSS. I think some of us are concern because FY 2016’s results are backed mainly by a once off income gain by the government.

once off income.png

If you realise without the once off income, they would only have about $3 million in profit for FY 2016. That translate to about PE 28x at current price. To see if the current price is considered undervalued after factoring some future catalysts, I shall try to do a conservative estimation based off some assumptions.

  1. No growth in PE business
  2. Company manage to retrieve oil from the ground
  3. Price of oil remains in USD$40 to USD$50 per barrel

Assuming there is no growth in the PE business, we are looking at a revenue of $70 million and an EPS of SGD 0.6 cents.

Now according to a QPR by GSS, there is said to be 24 million stock tank barrel of oil reserves in the Trembul area up to 800m deep. GSS subsidiary PT SGT a 49:51 JV is entitled to about 23% of the oil reserves there. So GSS is entitled to 49% of the 23% of total oil there are.

gss QPR trembul.png

GSS’s contract with Pertamina is for 15 years, that would entitle GSS to have

49% of the 23% of 24 million barrel of oil = 2.70 million barrel of oil and after 3 years GSS’s stake will increase to 89% of the 23%.

Assuming a more conservative figure — GSS are entitled to only 2.16 million barrel of oil

So 1 year = 144 000 barrels of oil

Assuming GSS cost price per barrel is USD $20 (actual estimated is USD $12) and price of oil ranges from USD$40-50 (Let’s take USD $40 to calculate)

Net profit for GSS oil business per year (first 3 years) = USD 2.88 million = SGD 3.75 million (USD/SGD of 1.3) = EPS of SGD 0.755 cents

Total EPS when O&G comes online = 0.755 + 0.6 = 1.355 cents

Which translate to a PE ratio of 13 at share price of $0.175 (the price which CEO last bought his shares from the open market). Also note that my calculation is only valid for the first 3 years as after that GSS’s stake will increase to 89% as per the agreement signed.


If we were to consider oil profits from the 3rd year onwards**:

89% of 23% of oil reserves = 4.97 million barrels a year (from 3rd year onwards)

To be conservative let’s take around 4.5 million barrels.

Net profit for GSS’s oil business per year (from 3rd year onwards) = USD $90 million = SGD 117 million (USD/SGD =1.3x) = EPS of  SGD 23.5 cents

Still assuming no growth in PE business from 3rd year onwards, total EPS = 23.5 + 0.6 = 24.1 cents.

Which translate to a PE of 0.7 at price of $0.175.

This is could be why CEO’s Sydney emphasize that GSS is undervalued.

The above is taking into consideration that there is no growth in the PE business and that oil prices ranges from USD$40 to USD$50 per barrel.

**However, its good to note that my type of calculating is not the most accurate as company will not be able to drill the exact amount every year. Hence, I hope my calculation help to shed light on how lucrative the potential of the oil business can be to GSS which is why in my opinion, many investors are waiting to see if the oil business will become successful.

 In conclusion,

one should monitor FY2017 closely to see the rate of change of pure earnings Q over Q. Supported by positive tailwinds from the semiconductor boom and with oil prices stabilising out, it is definitely a growth company at an inflection point. FY 2017 result may not be higher than FY2016 but one should always look at the real growth rate of earnings to determine if there is growth potential in the company. With that, I shall end my analysis, rmb to DYODD!

[Building Blocks]: Dissecting the Annual Report (Part 2)

Hi all, today I will be continuing with Part 2 of Dissecting the Annual Report. In part 1, I shared about some ways to dissect the annual report in order to find the information that you need. For those who missed it, you can read Part 1 here. Today, I will be going more in depth into the financial statements portion of the annual report. The financial statements in the annual report is an important piece of document that shed light on how the company is doing and challenges that the company may face.

financial-statement-post-pic

The financial statements in the annual report always consist of 1) the Balance Sheet, 2) the Income Statement, 3) the Cash Flow statement and 4) the Statement of Equity. We will focus on the first 3 as the statement of equity is used less frequently.

My Strategy

Whenever I look into the financial statements of any company, I do it for 2 reasons. It’s either to identify if the company is fundamentally sound to invest or to evaluate the financial health of a company after every earnings report season that I am already vested in.

When deciding if a company is fundamentally sound, I would look for stability of earnings, debts level and their cash flow which I wrote about here. After, confirming that the company is a fundamentally sound company, I will scrutinise their financial statements further for any abnormal figures. This can come in the form sudden increase when compared to previous year’s figures or extremely high figures. As for companies that I am already vested, I always try to look out for abnormal figures when compared to the previous year.

By doing so, I am able to detect any drastic change that may happen to a company. This is because any abnormal figures usually have a huge impact on the company. For instance, when the company suddenly register a 50% decrease in Cash & Cash Equivalents in their balance sheet, you must find out what did the company spent the money on. Is it for expansion or paying down debts? Will this affect their operations etc etc. Hence it is important to always find out about abnormal figures that may puzzle you when you read their financial statements.

Alright, with that aside, we shall dive deeper into the financial statements. I will share with you the important things to look at and some basic calculations you can make to better understand the financial health of the company.

1) Income Statement

Let’s start with the income statement. The income statement is basically a summary of profit and loss for the company. It documents the revenue and expenses for the specific accounting period.

aem-3q-result

The above is an example of the income statement of a company.

Things to know:

  • Revenue – a gauge of the amount of sales (look for stable or increasing revenue)
  • Gross Profit  – this is obtained after subtracting costs of goods from their revenue.
  • Gross Profit Margin – this is obtained from dividing the gross profit by the revenue (High GPM shows that the company have some form of competitive advantage over their rivals)
  • Operating Expenses – which consists of all expenditures that are not directly associated with the production of the good or services. Expenses like R&D costs, depreciation, amortization etc (Companies with durable competitive advantage have consistent operating expenses)
  • Earnings Per Share — EPS is based on net profit attributable to shareholders after deducting any provision for preference dividends and then divided by total shares outstanding. (An increasing or consistent EPS is always preferred)


The income statement is important in telling me if the company’s business have a form of moat around it and also if the company have been able to keep costs low.


2) Balance Sheet

The balance sheet documents the assets, liabilities and the shareholders’ equity of a business at a particular point of time.

aem-balance-sheet

Things to note in a balance sheet:

  1. total assets = total liabilities + total equity
  2. Current assets refer to assets that can be liquidated into cash within a year
  3. Current liabilities refer to the money to be paid in less than a year
  4. Non-current assets refer to assets that takes more than a year to be converted to cash. For eg, property, factory buildings etc
  5. Non-current liabilities refer to the money payable after 1 year.
  6. Shareholders’ equity refer to the net worth of the company
  7. Current Ratio calculates the company’s abilities to meet their short term obligations. (Current Ratio = Current assets divided by Current Liabilities)


Important values:

  • Cash & Cash Equivalents > Total Debts – I always try to ensure that the company have enough cash on hand to pay off their total debts. An over-leveraged company is a troublesome company.
  • Current Ratio > 1.5


For me, the balance sheet is important in telling me if the company will have a problem of paying their dues.

3) Cash Flow Statement

The cash flow statement records the cash inflow and outflow of a business. The cash flow statement shows how changes in the balance sheet and the income statement affects the cash and cash equivalents.

aem-cash-flow

It consists of 3 parts. 1) Cash flow from Operating Activities which records the net cash into or out of the business from their main operations. 2) Cash flow from investing activities which records the cash movement from the company’s investment. For instance, purchase or sale of a property, subsidiary etc. 3) Cash flow from financing activities records the cash movement of financing activities in the company.

Cash Flow from Operating Activities

A positive cash flow from operating activities means that cash is flowing into the company from their business. This means that net of all the expenses, the company is receiving cash from the products they sell. This is important as you want a company to take in cash from the products they sell. A company with consistent negative cash flow from operating activities is burning through cash fast and may need to take on debt in the future to finance their expenses. Hence, we would want a company to have positive cash flow from operating activities.

Cash Flow from Investing Activities

Purchase of assets, company investing their money in the market etc. These are all counted as cash outflow from investing activities. Sale of an asset etc will be register as an inflow. This section can tell you if the company is spending money to expand their current infrastructure or expanding capacity through higher capital expenditures.

Cash Flow from Financing Activities

Financing activities include payment of dividends to shareholders, paying off debts, money used in share buyback etc. In this section, you will be able to find out what the cash is used for in their financial activities. For instance, a negative cash flow from financing activities can mean that the company is paying off its debt. A positive cash flow from financing activities could mean that the company is raising money through selling new shares in the market etc.

The sum of all three sections above will give the net change in cash and cash equivalents which will be added to the amount of cash they have at the beginning of the year. By understanding the functions of the different sections of the cash flow statement we can better understand what the company is doing with their cash.

Disclaimer

Not all companies’ financial statements follow to the template I describe above. A lot of them have to be evaluated in the context of their business. For instance, although I emphasised a lot on positive cash flow from operating activities,.property developers would register most of their cash flow in the investing portion than operating activities when they sell a completed property project. Hence, the financial statement should be read in context with the industry the company is in.

In conclusion,

the financial statement is a powerful tool to better understand a company. In fact, I am also still in the process of further deepening my understanding of the financial statements. The management may coat investors with nice narratives about the brilliance of the company but you can always cross check what the company is saying with their financial statements to gauge their reliability. Understanding the financial statements will definitely level up your investing many folds! 🙂


[Eye Candy]: Nordic Group riding on O&G recovery?

Nordic Group have long been in my eye candy list for some time now. Not only does it have a good fundamentals, it has been able to withstand the chaos in the O&G sector while posing earnings growth during this period of time. A company that can withstand headwinds in the industry are certainly poised to do well when the sector recovers.

nordic-group-limited

Nordic Group is a global systems integration solutions provider serving mainly the marine, offshore and oil & gas industries. Their business segments include 1) system integration, 2) maintenance, repair, overhaul and trading, 3) precision engineering, 4) scaffolding services 5) Insulation services. Most of their businesses are in the O&G sector but they also do serve the aerospace and medical industries. (But to a small portion)

Fundamentals

1) Strong earnings record

As I mentioned earlier, Nordic have managed to grow their earnings rather significantly over the past few years. Even when many O&G companies (their customers) are cutting budget and hence spending, this company have punched above its weight. Here’s a snapshot of its financial highlights.

nordic financial highlights.png

Various indicators of earnings are all pointing upwards, which shows the strong earnings momentum the company has. Also 2016 being the year where O&G sector faced many unpredictable headwinds, like falling oil prices. Nordic have still managed to grow its revenue.

nordic-q4-result

Despite challenges, revenue for FY 2016 increase 2%, profit net of tax increased 21%. If Nordic can weather the storm in the industry, it should present a good growth opportunity when eventually the industry recovers and O&G companies start to spend again.

2) Strong balance sheet and cash flow

Current ratio of 1.74, with cash and cash equivalents covering its debts. Nordic have also been registering positive cash flow from operations for the past few years.

Fundamentals.png

3) Insider ownership

nordic-insider

All 3 executive directors of the company are part of the 20 largest shareholders in their own company. Furthermore, company have been doing regular share buybacks. Latest one being at $0.24 a share.

Catalysts

Going forward there are a few catalysts that could propel the stock further.

1) More contract wins and possible acquisitions

With oil prices stabilising around $50 per barrel, compared to the atrocious $30 per barrel at the start of 2016. A recovering 0&G sector can be beneficial for Nordic as more of their customers start spending more to upgrade or improve their facilities. This should lead to more contract wins for Nordic given the strong reputation it has in the industry. With Nordic low debt, they could also possibly look to acquire companies in similar industry to boost their source of revenue, just like the acquisition of Austin Energy in 2015.

2) Going into pharmaceutical industry

In the AR of 2015, the Chairman also mentioned going into the pharmaceutical industry. This should open up new form of revenue stream and allow Nordic to grow their business out of the O&G sector.

austin-energy

Technical

Based on the chart, this gem have already been discovered by many investors.

Nordic chart.png

Clear and nice uptrend. Currently, Nordic have reach upper channel line and I am hoping the pull back will hit the support at $0.270. This will present a rather lucrative price to enter given the upside potential.

In conclusion,

this is a rather straight forward company to analyse. Strong fundamentals and possible tailwinds to promote growth should the O&G sector improves. $0.270 will be a great price to enter!


[Building Blocks]: Dissecting the Annual Report (Part 1)

Buying and selling stocks are easy, but the amount of research one puts into determines your profitability. One such place to find out more about a company current performance and future plans is through their annual reports. The sage of Omaha, Warren Buffett revealed that his success in investing comes from reading hundreds and hundreds of annual reports every year. If annual reports are this important, how do we go about understanding it and finding the information that we need. Today in part 1, I shall share a bit on how I dissect the annual report into digestible parts. In part 2, I will attempt to muster what little accounting knowledge I have to share with you how to look for specific measurements that indicates the health of the company through their financial statements.

warren-buffett-on-annual-report_finaacle.jpg

In my sharing, I will use the FY 2015 Annual Report of AEM Holdings. You can download it here to follow along as I dissect the annual report.

1) Where to find a company’s Annual Report?

Any public listed company will have to file their annual report with the stock exchange. This report can be found either from the website of the stock exchange it is listed on or in the investor relations segment in the company’s website. Here’s an example of where you can find the annual reports for AEM Holdings.

2) What to do with the 100+ pages monster?!

Yup, a company annual report tends to be 100 over pages long! (At least in the case of SG companies) Don’t worry, not every part of the annual report is equally important. Locating the parts that give you what you need is more essential.

annual-report-content-page

This is a typical contents page of a company’s annual report. It is almost a standard format of annual reports which is comparable to many other companies’.

3) What information is important to me?

When analysing a company’s annual report there are always some standard information that is important to a shareholder. This can range from their financial performance to who exactly is running the company. Below are some information which I always look out for when I read a company’s annual report.

  1. Present company’s performance
  2. Company’s outlook and future catalysts
  3. Management’s information

4) Where to find these information?

Present company’s performance

We want to understand how the company is doing for the past financial year and most importantly their financial statements for the FY. This information can usually be found in 1) The Chairman’s and CEO’s statement, 2) Business and Financial Review (some company may name it differently but it is basically just a summary of financial figures for the FY), 3) The full financial statement in corporate information

aem chairman statement 1.png

Here’s a snippet of the present performance by the Chairman. You can likewise find the same from the CEO in the next page.

Business review AEM.png

Under the business and financial review, the company tends to show a quick summary of financial performance for the FY. They can come in the form of informative illustrations comparing their performance over the past few FYs. I tend to read this part with a pinch of salt. This is because the company may tend to cherry-picked “nicer” numbers to put here to impress shareholders. A in depth analysis into their full financial statement in the corporate information segment is needed to determine the reliability of their performance.

If you are lost. You can find the above information from page 36, 40 and 37 respectively. A financial statement usually includes the Balance Sheet, Income Statement and Cash Flow statement. I will touch on these in part 2, but just know that these 3 pages are one of the most important part of any Annual Report. You will also notice one whole bulk of information which occupies majority of the annual report in Notes to Financial Statement. Basically this part give additional pointers to how each segment in the financial statement were derived.

Company’s outlook and future catalysts

You can usually find a company’s future plans and outlook from the Chairman’s and CEO statements. This is usually found at the last few paragraphs of their statements. They will address challenges and the strategies going forward. Any upcoming plans are also explained here.

aem-chairman-statement-2

During the FY 2016, you can stay tune to their announcements as they may announce some information about whatever plans they were set out to do in FY 2015. This can supplement your information about the company’s outlook and plans.

Management’s information

It is always important for me to know who are the people that are running the company. To find this information, you can look them up in the portion Board of Directors.

aem-board

They usually include a short write up about the achievements of the person and his previous experiences.

Knowing how much the management is earning is also important. This is because we want to ensure that the management have their interests aligned to ours’ and are not overpaying themselves. You can find out details about remuneration in Corporate Governance on page 23 of the annual report.

aem-remuneration

In a board of any company, it is made up of the Chairman, CEO, the independent directors and some other position depending on the company. The independent directors are just people who are not related to the company but sitting in the board. This ensures that the Board do not do things that are beneficial to themselves only and in turn harming the shareholders. It is a common sight to have independent directors in any listed company. You should pay close attention to the payslip of the Chairman and CEO. Make sure they do not give themselves too high a pay.

One simple way to see if the Chairman and CEO have interests aligned to the shareholders is to see if they hold the company’s shares. You can find that either from the variable bonus component in the remuneration package above or from page 92, Information on Shareholdings.

aem-shareholdings

The CEO is one of the top 20 shareholders of the company’s shares. If the insiders of the company have rather large stakes in the company they should act in the interests of the shareholders.

In conclusion,

these are usually the information that I look for when I read into any companies’ annual report. By categorising the annual report into 3 key areas, we can effectively understand the company. In the next part, I will mainly talk about how to break down the financial statement in the annual report to help you understand some accounting jargon. Ohh and on the side note, if you have been a regular reader of this site, please do subscribe so I know roughly how many active readers I have and you can also comment below if there are any queries. Hahaha! Thank you! 🙂


[Eye Candy]: Addvalue Tech, a turnaround play?

Greetings, pardon my corny title above. Haha! Recently, I have been browsing through some companies that could provide great investment opportunities in the near future. My rationale for doing this is so I can put all them on a watchlist and enter them when the time is right. Haha I decided to name this segment “Eye Candy” to remind myself that for now I can only look at it and not take any actions. Haha! Also, I don’t intend to share this on Facebook, as this is purely for me to understand my own line of thinking and for those who chanced upon it on my blog. Alright, let’s dive straight into this company that I found rather interesting. Addvalue Technologies.

Image result for addvalue technologies ltd

Before we go into the nitty-gritty of the company. Let me give you a brief summary of what the company does. For simplicity sake, I will call the company AT in the remaining part of the thesis. AT is a company that provides satellite based communication terminals and solutions for a wide range of  voice and Internet protocol (IP) based data applications. To put it simply, their business revolves around getting you connected to the communication network (internet data, voice calling etc) in places that communication network are not available. For instance, ships out at sea do not really have a fix communication network they could tap on. AT creates a dongle-liked thing which allows you to serve your internet and make phone calls out at sea. They IPO in 2001 when they were in the consumer telecommunication business. Due to strong competition, they sought new growth area and ventured into their current business in 2006.

What I like about this company is their spirit of innovation to venture into a new business when things aren’t doing well. Of course, spirit or not doesn’t matter if their results do not show. Let us then take a look at the fundamentals of the company.

Fundamentals 

To get a holistic view of the company, let’s take a look at the financial report for the past 4 years.

Financials.png

Sorry for the bad alignment!! Haha my first time trying this. As we can see that the company earnings have not been consistent. There has only been 1 profitable year which is in 2014. So I was curious what has caused the company to record losses in FY 2015 and FY2016 when FY 2014 was in the black.

FY 2015

FY2015 problems.png
From AT Annual Report

Profitability was hampered by once off kick ups like buying more expensive materials and R&D efforts.

FY 2016

FY 2016 problems.png

As we can see FY 2016 was impacted by 2 delays which are both related to their working partners. AT ‘s business depends a lot on satellite telecommunications companies like Inmarsat and Thuraya which AT have long partnership with. AT creates the satellite terminals and use their satellite systems to provide connections to consumers who buy their products. Also it’s expansion into China have also been met with some problems cause by economic headwinds.

Balance Sheet wise, AT do not fare well too. It’s borrowings are high. Current ratio do not look good. Very little cash on hand.

Liabilities 2016.png
FY 2016 Annual Report

Hmm not a very good sign…

Cash flow from operating activities have also been in the negative for the past 4 FY except FY2014. Fundamentally this is a company that I would avoid at all cost. But after examining the potential catalysts and the earnings for the 2Q in 2017, I feel that the company could be at its inflection point.

These are some potential catalysts for this company.

1) Earnings growth for first 2 Quarters of 2017

1q17

A 136% increase in gross profit in 1Q 17. (I think there was a typo in the report, but the values on the left usually represents the latest Q)

1h17

A 141.6% increase in gross profit in 2Q17. For the HY, a 139% increase. Comparing 1Q17 to 2Q17, the gross profit also grew 14.5%. That shows an increase rate in earnings as well. That is an encouraging sign.

2) Stronger foothold in China

China MOU.png

This MOU is announced in 26 Oct 2015. AT is required to design and supply products for the “One Belt, One Road” project. AT also entered into a strategic alliance with Zhong You Century a govt linked company in China.

Chinese deal.png

The deal came in after FY 2016 which will benefit FY 17. If you have read about China’s ambitious “One Belt, One Road” initiatives, you will realise that these deals will keep coming given the vast scale of the project itself. Also, if AT have anchor their working relationship in China, future projects in China will more or less be awarded to them. This will provide a form of stable revenue less likely to be impacted by economic headwinds given the strategic importance the One Belt One Road initiative is to China.

3) New product pending commercialisation

AT who have been engaging in R&D and constantly coming out with new products could see their latest product being a game changer. The new product named the Inter Satellite Data Relay Terminal (IDRS). Basically, this product will address long standing issue of communication with Low Earth Orbit Satellite (LEO). Normally a LEO satellite is used to collect data on several information about Earth ranging from climate to land information. Currently, sending data from LEO requires its orbit to meet with the location of where the observer is. In lament terms, there are only certain window of opportunities whereby information from LEO can be sent to the observer. With this new product, AT have circumvented the problem and their new product allows the LEO satellite to be able to communicate with the observer 24/7. This is a first in the industry, and will definitely provide a new form of revenue to AT.

IDRS MOU.png

Just recently, AT announced a MOU signed with Inmarsat to commercialise the IDRS. This will be an exciting development to watch. Whether or not, it will contribute to FY17 revenue will really depends on the rate of commercialising this new product. Just like any first of its kind product, this will give AT an early mover advantage into this market.  Furthermore, if this is patented (I’m not sure if the AT is intending to) it strengthens their market share in the market.

4) Disposal of Addvalue Communications Pte Ltd

The planned disposal of AVC was announced in 2014, but the deal has since been delayed till today. The disposal price is a cash offer of $308 million dollars. If successful, this should help improve AT’s balance sheet and give it enough cash to further expand their operations.

5) Restructuring efforts

rebranding.png

AT is trying to restructure their business model to include avenues for recurring income from airtime etc. This should provide some stability to earnings in the future. rebrandin.png

They will be focusing more on emerging markets like China.

In conclusion,

I feel AT is company that is daring in their approach and not afraid to fail. Being the one of the few listed company in Singapore to venture into the space and satellite industry in 2006 is certainly a bold move. On many occasions, the management have also shown that the company is capable of innovating new products. Although for many years their earnings and balance sheet have not been outstanding, the current list of catalysts should benefit AT favourably in the near future.

at chart.png

AT is currently trading at $0.037, which is around the lowest it ever recorded in its entire listing history. (Lowest was about 0.027). Of course, that doesn’t mean that the stock cannot continue to go down and eventually hit 0. However, given the limited downside risk and the upside potential. This could be a favourable entry point. However, I would still prefer to wait for the upcoming earnings report for more earnings stability before taking any decision. If I am going into this one. It should be a long position. Ultimately, the appreciation of the company stock price on the stock market is more often marked by the increase in earnings. Will Addvalue Tech eventually turnaround their company? Only time will tell.

That’s it from me. This is probably my longest post ever haha! Ohh rmb to dyodd and this post does not in any way promote you to buy this stock. It’s just my own humble analysis. 🙂

[Building Blocks]: How should I get started?

Hello everyone! Hoped that all of you had a great CNY holiday. Haha since I am now on my CNY block leave I decided to write today. In my previous few “Building Blocks” blog posts, I have talked quite a bit about the different styles of investing and the all so important investment objectives that everyone should have before investing. Since we are all richer due to our red packets (for those singles out that :P), I thought it is timely that I should touch a bit about how to actually get started.

Off my head, I thought of a few questions that a new investor would have when he/she is starting out.

  1. How much should I invest?
  2. What to invest?
  3. How do I go about doing it?

(Do reach out to me in the comment box if you have any more questions about investing. :). I will do a separate blogpost to address those questions if any haha)

There are 2 investing instruments that I would recommend a young and new investor to consider that would answer the above questions.

1) Regular Saving Plans (RSP)

What to invest?

 RSP is a great way to get started on investing. Most of the banks in Singapore offer RSP, but since most people are account holders of DBS or OCBC. I will mainly touch on the RSP programme that the 2 big banks offer. For me, I would recommend against investing in mutual funds because they tend to do worse than the general market in the long term. I would prefer a RSP in an index fund or an Exchange Traded Fund (ETF). Both the index fund and ETF are created to match the performance of the broad market. For instance, the STI ETF is created in a way to match the movement of the STI (the top 30 companies in the SGX). So whatever happens in the market, will be reflected in the fund. Also, sales charges for these type of funds are generally cheaper than a mutual fund because there are lesser transactions (less actively managed) made by the fund manager.

So how does a RSP works? A RSP invest a fixed amount of money every month into the fund you are intending to invest in. For instance, you could do a $100/mth RSP in the STI ETF.

pros-and-cons-of-rsp

RSP is mainly for those who want to invest for the long term and may not have a huge upfront capital to invest at one go. Think of this like putting your money into a piggy bank that yield higher interest rates than your normal banks’ interest rate.

STI ETF returns.png
If you hold this STI ETF for 5 years you will get a pretty decent 4.66% return compared to the bank’s non-existent interest rate

How much to invest?

This question will really depend on yourself. How much will you be able to take out from your monthly income to ensure that your living expenses etc are not affected. Since the RSP will only see fruition in the long term, cancelling the plan midway is not very beneficial to you. Hence, it is really up to you to decide the amount. In SG, the minimum amount to put in an RSP is $100/mth.

How do I go about doing it?

DBS and OCBC both have different types of RSP. You can only get an RSP with them if you are an account holder of the bank. For both banks they offer investing in RSP in unit trust. Do note that unit trusts are usually investment in mutual funds which I do not really recommend. (But of course if the funds have a good track record of returns then by all means). What I would recommend is their RSP in ETF and equities.

For DBS, their RSP allow you to choose between the NIKKO AM  SG STI ETF (the one shown above) and ABF SG BOND INDEX FUND (which invest in the bonds of SG)

For more info on DBS RSP, click here

For OCBC, their RSP is different from DBS, OCBC allows you to invest in blue chip companies in the SGX. The plan is called Blue Chip Investment Plan. Basically, the same concept of RSP applies but they invest your money into a blue chip counter you choose monthly. Of course the charges are a bit different for this plan.

For more info on OCBC Blue Chip Investment Plan, click here

Summary

The RSP is a very powerful tool and forms a relatively risk free investment vehicle for starters, but it must be held for the long term in order to realise the gains. For young investors who may not have a monthly pay now, this could be a bit of a problem as you may need to scramble enough cash in your bank account before the investment date every month. Ultimately, you need to carefully plan your expenses before you embark on this plan.

2) Investing directly in the stock market

What to invest?

The other way to invest is to invest directly through the stock market. Imagine the stock market as a big supermart and in the supermart there are a myriad of products on the shelves. Some may be more expensive but of better quality, some may be cheaper but of poor quality, some may be a new product that has just arrived etc etc. The trick here is to pick the right product that suit your personal taste and preference. And all this can be answered by your investment objectives. The stock market can be categories into 3 groups in terms of risk level.

risk-table-for-investing-in-stocks

If you are new to the market, you can consider your first stock to be something relatively of lower risk like an index ETF or a blue chip (Do note that there are many other ETFs too which have different objectives.) Slowly, as you learn more about how to evaluate a company fundamentally and technically based on their chart (which I will also share with you in future posts) you can invest in normal equities while minimizing your risk.

How much to invest?

This is again a subjective question. But I will share with you some pointers I learn while investing in the stock market with little upfront capital. Firstly, the commission for most brokerage houses in SG is at least 40 SGD for a two way trade (Buy and Sell). So the lesser the amount of money you invest in a stock, the larger the percentage that the commission will stand in your profit. Ultimately, you want to make a profitable trade so taking into account the commission is very important. Secondly, with lesser amount of money, the multiplier effect of your stock is much lesser. For instance, someone with 1000 shares will make more money than someone with 100 shares given the same percentage increase.

All in all, the commission cost is the first hurdle to cross before you can be profitable in any trade. And using the multiplier effect will greatly increase your chance of beating that first hurdle. So how much to invest depends on whether you can understand the risk reward ratio of the stock you are planning to invest and giving it sufficient amount of money to beat the first hurdle. For me, I always try to purchase at least 1000 shares in the stock that I plan to invest as it set a nice $100 return for every $0.10 increase in stock price.

How do I go about doing it?

First and foremost, in order to start investing in the stock market, you need to have a brokerage account that is connected to the Central Depository (CDP) which stores all the shares you buy in the SGX. There are several brokerage houses in Singapore, I will list out a few.

  • DBS Vickers
  • OCBC Securities
  • Philip Securities
  • CIMB Securities

Majority of the brokerage houses in SG charge about the same commission fees. A minimum of $25. Some brokerage houses have special programme to differentiate themselves. For instance, DBS Vickers Cash Upfront Account only charge a commission of $18 for buying. For brokerage houses that are owned by banks like DBS and OCBC, they would usually require you to have a savings account with them. 3rd party brokerage houses like Philip Securities doesn’t require you to do so. For me, I chose DBS Vickers because I am already using their savings account which save me the hassle to open another savings account with another bank. You do have to be at least 18 in order to open a brokerage account with some of the brokerage houses. Some require you to be at least 21. Hence it is important to research each brokerage houses first before signing up with them and you can have several brokerage accounts with different houses.

Here’s a good article to help you in choosing a brokerage house.

In conclusion,

these are the 2 ways I put forth for new investors to go into investing. Do always remember to do your due diligence before plunging into any decision and allocate your money well. That’s all from me today. If you have any questions, I would really love to hear them. Simply comment below and I will do utmost best to answer each one of them. Adios! 🙂

[My Story]: Investment takeaways from my first few trades

Hello everyone, it’s been a while since my last post. Sorry about that, haha was busy trying to learn coding. Haha I have to say that the activation energy to learn something completely new is super high! Going back to today’s post, I will be talking more about the first few trades that I did after my “Noble” failure. (Haha you can read more about it here) If you think that my next few trades should be much better, you may be wrong. I decided to try to trade in a few different stocks to understand how it works. Some work against me, while some earned me a pretty good return. So here goes…

image3
Closed Trade

The picture above was taken from my Stock Portfolio page from last year . Haha just look at the sea of red! Each closed trade in red are definitely scars I will bound to remember in years to come for experimenting in different types of stocks . Of course, I did draw some meaningful lessons from it, allowing me to update my list of things to NOT DO when choosing certain stocks. I will be sharing with you those lessons today.

1) Never look for stocks that are too “penny”!

Penny stocks are those that probably only cost a few cents sometimes not even 1 cent on the SGX. Different stock exchanges around the world have different meaning for penny stocks. For instance in the US, penny stocks are normally less than $1-2. Penny stocks are even more dubious if their fundamentals are not good. No strong record of earnings , questionable management etc. Also, penny stocks tend to be played by professional traders. They may buy up a lot of shares, since it is cheap and thus create a sign that the stock is trending up. Retail investors may get into the stock and when the pros sell the stocks, these retail investors tend to get trapped with a higher price paid for the penny stock. Hence, the risk for penny stocks are definitely high!

As for me, the 2 stocks that I bought into which were penny status were Cedar Strategic (530.SI) and GCCP Resources (41T). One cost me $0.004 and $0.06 per share respectively. Cedar Strategic had a troubled management in the past, and the new management came in ,divest away its loss making businesses and went into property development in China. The sales of the property seems to be going well and to be honest I was a little greedy, here’s why. If I bought $400 into Cedar, an increase of 0.001 will earn me a $100 profit. Of course that didn’t turn out well haha, the stock was so illiquid that the price of the stock can be the same for a few weeks. After a while I thought it was a bad investment on my part and decided to sell it away for 0.003. See what happened here? By selling away at 0.003, I incurred a $100 loss + a commission expenses of $43!

This taught me that:

  1. Penny stocks are usually businesses that may not have sound fundamentals.
  2. Penny stocks are usually illiquid and most of the time we have to sell lower due to low demand for the stock.
  3. Just as penny stocks have huge potential to double your money, it can also lose your money in double quick time.

2) For beginners, don’t buy into mining companies.

Mining companies are normally bad investment for beginners as they usually carry huge debt and have little or no profits. This is due to the nature of business. Mining companies borrow huge capital to buy equipment for mining. Furthermore, there are a lot of uncertainties in the mining industries.

  • There ore mined may be low quality and of no commercial value.
  • The mining company may not be profitable before their debts are due.
  • The profitability of mining companies are heavily dependent on the prices of the commodity they mine.

All these mean that the volatility in the mining industry is very high. For me I bought into CNMC Goldmine (5TP), Alliance Mineral (40F) and GCCP (41T).  All are pure mining stocks while GCCP is also a penny stock as mentioned earlier. But I would like to talk more about CNMC.

cnmc-goldmine

CNMC Goldmine mines for gold in Malaysia. The good thing about this company is that they have become operational and are actually mining gold from the ground. The company also benefitted from higher gold price. So I bought into this company at 0.425, it eventually rose to a high 0.50 cents mainly due to better production and increase in gold price. However, key events like the rates hike in the US eventually cause it to drop to a low of 0.40. Also, recently CNMC announce that the quality of gold ores they mined are of lower quality hence it affected their earnings too. I didn’t sell when it hit its high but sold only when the bad things start to hit the company and eventually I sold for a loss. Hence it was a painful lesson for me about the mining industry.

From this we can see the difficult industry the mining companies are operating in. Thus, in my opinion, for beginners it is best to avoid this industry altogether unless the company present a very promising growth catalyst in the near future.

These are the 2 lessons that I draw from the next few trades that I did after Noble. Although, it is not a rosy picture, I definitely learn a lot from it. Hope you guys get some insights from my humble sharing.

[My Story]: My Investment Objectives

Hello! Hoped everyone had a great New Year Day holiday. As mentioned in my previous post, today I will be sharing with you about my own investment objectives and my reasons for it.

My Investment Objective.png

I have done up a simple diagram of my own investment objectives. I prefer splitting my investment objectives in period of 5 years so I can have a holistic view on how my investment style changes with the years.

In 5 Years:

Why: As some of you may know, I did not start out with a huge upfront capital in investing. The average size of my trade is only a few hundred dollars per transaction. The multiplier effect of investment increases when more shares are bought. Hence, I decided to dedicate my first 5 years of investing to aggressively growing my capital. Since, I am in the army and will be in the university during this period, my tolerance for risk is much higher.

How: I will do so by looking into growth and value stocks which have higher potential for price per share appreciation. I will try to lock in at least 20% gain in price before selling the shares completely. Hence my holding period is not very long term. With that, it is also important to protect my down side. When I started investing, I did not actively pursue a stop loss and caused a great deal of problems for me. With such high risk pursuit of capital growth, having strict stop loss is important to protect your downside risk.

Characteristics:  

  • Look for growth and value stocks
  • Sell when stocks appreciated at least 20% in price 
  • Strict stop loss to prevent down side risk

In 10 Years:

Why: After the 5th Year mark, I should be out in the working world and making a regular income. Although I would still be young, its important to start saving for retirement. Hence, the percentage of my portfolio changes with an extra element of preserving my capital. Overall, I am still growing my capital but less aggressively compared to 5 years ago.

How: Likewise, I will continue to look for growth and value stocks to fulfill my investment objective. The added component would be to source for income producing assets, like blue chips, bonds, fixed deposit to preserve my capital.

Characteristics:

  • Look for growth, value and income stocks
  • For growth and value, same rule of selling when price appreciate at least 20%
  • Same strict stop loss for growth and value stocks
  • For income stocks, look for blue chips that pay regular dividends. Preferably reinvest those dividends. 

In 15 Years:

Why: After the 10th year mark, I would be in my 30s with much more responsibilities. Most of us would also get a HDB in our 30s. This will incur more expenses and hence it is more wise to be less risky and protect more of your capital. Hence, preserving capital becomes more than half of my portfolio.

How: Pursuit for growth and value stocks become less important. Looking for stable income producing asset becomes paramount.

Characteristics: 

  • Look for more income producing assets
  • Same rules applies for growth and value stocks

In conclusion,

its important to know how your investment journey will span out. Having a investment plan with clear investment objectives should help you make accurate investment decisions. When I first started out, I did not have such a plan, I plunged myself into different trades like a headless chicken and incurred heavy losses. Do not make the same mistake I did haha. Of course, life is not smooth sailing like you want it to be. Things change and crisis may emerge, thus it’s important to always review your investment plan and objectives yearly and tweak them accordingly. For those who may have yet to have an investment plan, feel free to try out my method of planning and let me know if its helpful. Here’s to a great 2017 for all of us!

[Building Blocks]: Knowing your investment objectives

In my previous post, I talked about the styles of investing that majority of investors subscribe to. In it, I also mentioned that knowing one’s investment objective is key to understanding oneself before plunging into the investment world. To be more specific, by investment objectives I mean what do you hope to get out of your investments. Is it short term gains or long term income investment? Most of us should be working towards long term income gains. Thus, knowing what you want to achieve out of your investment will guide you along when you are making your investment decisions.

How to determine your investment objectives?

There are really no hard and fast rules to go about this. However, I would like to present some guiding questions which may help you go about crafting your own investment objectives. These investment objectives should be the main overarching lighthouse that guide your investment decisions.

1) What’s your risk appetite?

Are you someone who can sleep well at night if say your stock took a 10 percent plunge during the trading day? Or are you the type that worry even if the stock were to fall slightly. These questions are important because investing shouldn’t stress you out too much and compromises your health. You should look for something you are comfortable with and invest in it. Typically, a younger investor would be more risk adverse because they know that their investment time frame is longer than someone in their 50s or 60s.

2) What’s the proportion of your savings you are using for investment?

If you are putting up 90% of your savings to investment then it is important to diversify your portfolio with safer stocks because a large portion of your savings are inside it. I am not saying that its wrong to use 90% of your savings to invest. Just that if you are putting such a large proportion it pays to be a bit safer with it. By answering this question, it should help you decide how to distribute your money in different investments of different risks.

3) Are you short term or long term?

Are you someone who gets excited over small price increase and are eager to sell it to realise the gains or someone who is very patient and wouldn’t mind to wait for 10 years to realise the gains? This is important because it will determine what kind of stocks you will tend to choose. Those who are short term tend to trade on price action, are quick to take the profit off the table and then plunge into another trade.  Someone who is short term takes on more risk than someone who goes for the long term since there have been more bull markets than bear markets in the long run.


By answering some of these guiding questions it should give you a better understanding about the type of investor you are and what is at stake. Only when you know the type of investor you are can you go on to set a relevant investment objective and subsequently your style of investing to achieve your objective.

For me personally, I plan my investment objectives in 5 , 10, and 15 years so I get a holistic view of how my investing objective and style will change eventually. For instance, in 5 years, I am looking for more short term gains to quickly multiply my capital before I switch more towards looking for dividend paying stocks for the long run. I will share more about my investment objectives in the next post. That’s all for today! Have a great Christmas ahead! 🙂